
Code For Trading#
Pandas is an excellent library for analyzing and dealing with data.
In order to calculate profits and how much money to I put into the market, I use a formula after downloading my data from RBC direct investing.
import pandas as pd
data = {
    "Activity": {
        0: "Buy",
        1: "Buy",
        2: "Deposits & Contributions",
        3: "Withdrawals & De-registrations",
        4: "Deposits & Contributions",
    },
    "Symbol": {0: "BB", 1: "RBF556", 2: "", 3: "RBF558", 4: ""},
    "Value": {0: -100.95, 1: -2328.24, 2: 1000.0, 3: -14000.0, 4: 15000.0},
}
df = pd.DataFrame.from_dict(data)

print(df)

deposit_df = df[df.Activity == "Deposits & Contributions"]
divid_df = df[df.Activity == "Dividends"]
with_df = df[df.Activity == "Withdrawals & De-registrations"]
total = deposit_df['Value'].sum() + with_df['Value'].sum()
print(total)
                         Activity  Symbol     Value
0                             Buy      BB   -100.95
1                             Buy  RBF556  -2328.24
2        Deposits & Contributions           1000.00
3  Withdrawals & De-registrations  RBF558 -14000.00
4        Deposits & Contributions          15000.00
2000.0
# download files for S&P 500 plot
# http://www.cboe.com/publish/scheduledtask/mktdata/datahouse/vixcurrent.csv
import pandas as pd
import io
import requests
import yfinance as yf
import mplfinance as mpf

# data is only up to 2004
url = "http://www.cboe.com/publish/scheduledtask/mktdata/datahouse/vixcurrent.csv"
s = requests.get(url).content
vix = pd.read_csv(io.StringIO(s.decode("utf-8")))
# VIX Open,VIX High,VIX Low,VIX Close
vix = vix.iloc[
    1:,
]
vix.columns = ["Date", "Open", "High", "Low", "Close"]
vix["Date"] = pd.to_datetime(vix["Date"].astype(str), format="%m/%d/%Y")
# vix.rename(columns={"VIX Open": "Open", "VIX High": "High", "VIX Close": "Close"})
vix[["Open", "High", "Close"]] = vix[["Open", "High", "Close"]].apply(pd.to_numeric)
vix = vix.set_index("Date", drop=True)
vix.to_csv("vix_curr.csv", index=True)

sp = yf.Ticker("^GSPC")
# Consider grabbing for valid date index instead
history = sp.history(start="2004-01-02")
apds = [
    mpf.make_addplot(vix.Open.values, linestyle="dotted", ylabel="Volality VIX (Open)"),
]

fig, axes = mpf.plot(
    history,
    addplot=apds,
    ylabel="Price (USD)",
    returnfig=True,
    figscale=1.2,
    title="S&P 500",
)

axes[0].legend(["S&P500", "VIX"], loc="upper left")
fig.savefig("vix_vs_s&p500.png")
Which produces the following image
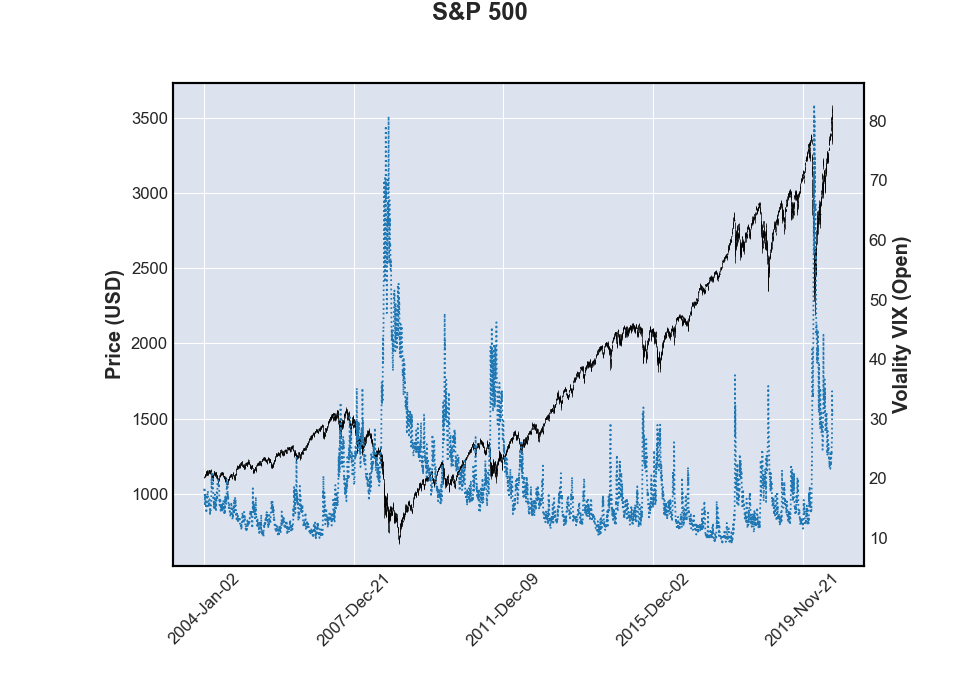
If the vix is spiking way above the graph and the s&p500 is low, then it is an excellent time to buy.
Thoughts on algorithmic trading#
Some of the assumptions made during algorithmic trading are fairly interesting
You can focus on either internal events or external events (like covid19).
You assume the stock price fully prices in earnings and revenue projections (not always accurate), especially for small caps.
An reinforcement algorithm only attempts to make the “right” decision and not predict the price.